The Reports Dashboards is the most visual and easy-to-use section of MyApiarys reporting. This page will show you quick information on autogenerated graphs that relate to activity from the last 3, 6, or 12 months. this page will graph Hive Strengths, Number of supers, Hive deaths and why, Disease observations and what diseases, Requeening numbers, and reasons why, Jobs Completed and Consumables used, all in one page!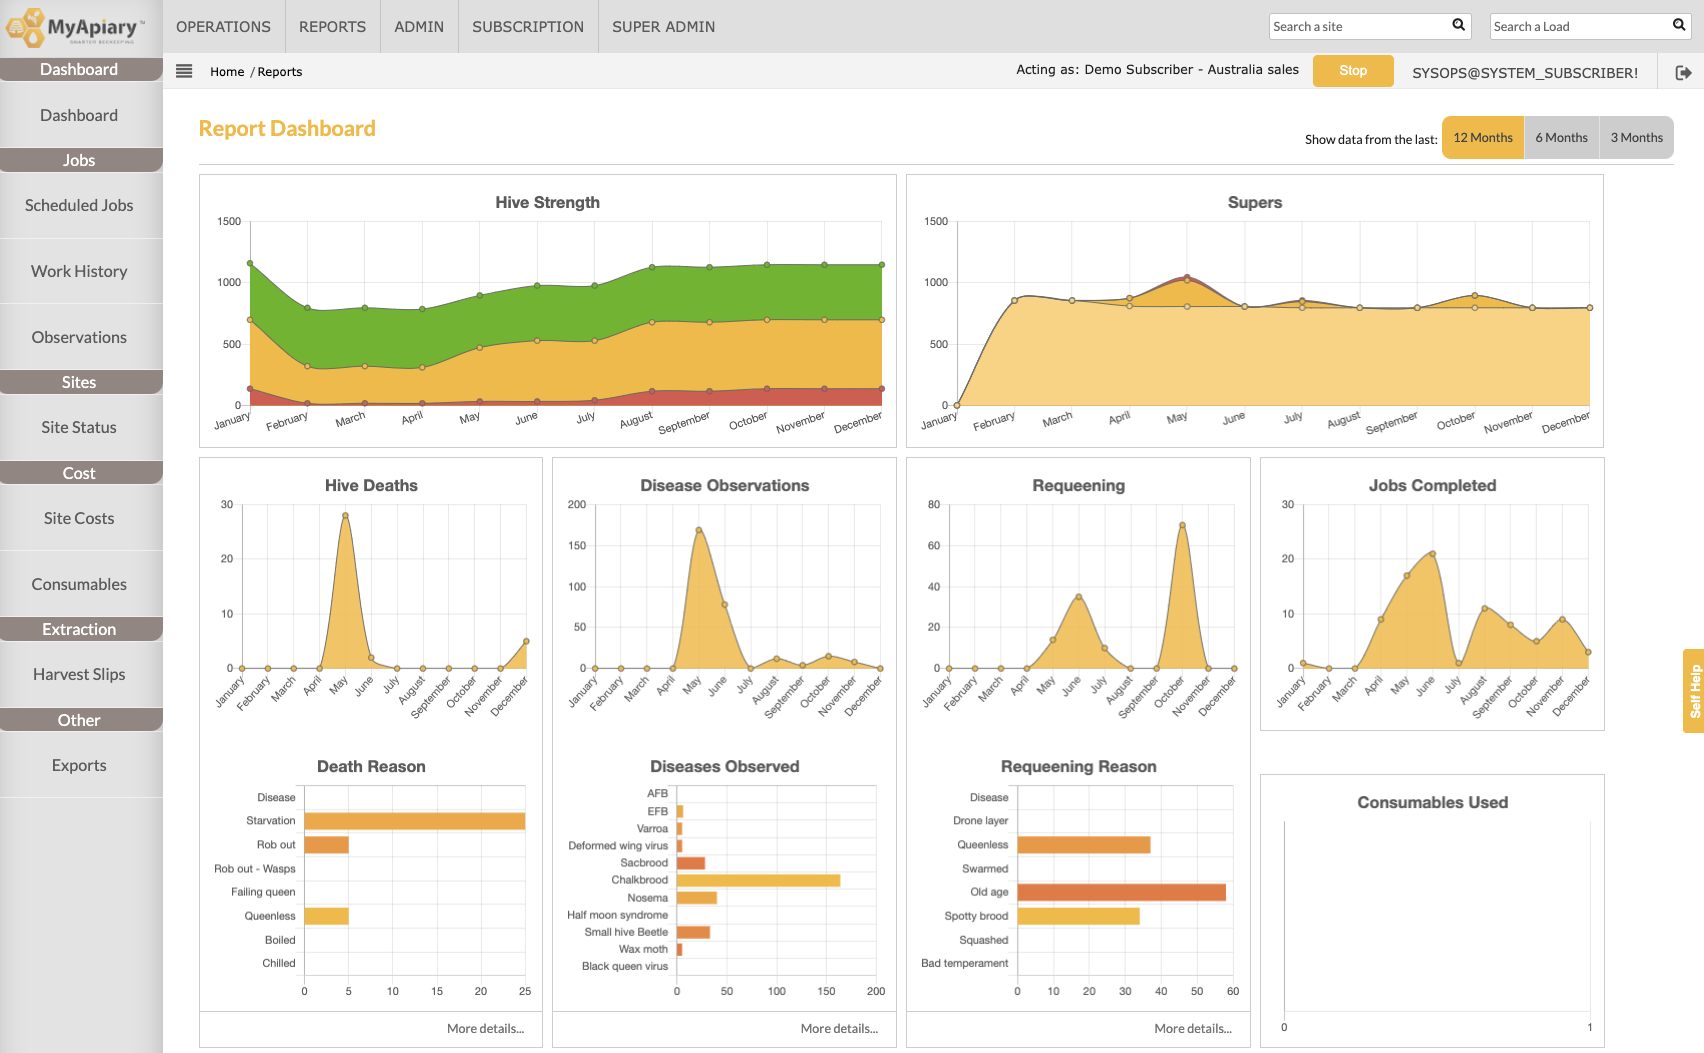
From here the other tabs for reporting are far more specific and customizable.